滅多なことでは使う機会がないと思うのですが、matplotlibで使える色名の中に、
Tableauのカラーパレット(Tableau 10)の色を指定するものがあるのを見つけたので紹介します。
参考:matplotlib.colors
こちらのページにひっそりと次の記載があります。
one of the Tableau Colors from the ‘T10’ categorical palette (the default color cycle): {‘tab:blue’, ‘tab:orange’, ‘tab:green’, ‘tab:red’, ‘tab:purple’, ‘tab:brown’, ‘tab:pink’, ‘tab:gray’, ‘tab:olive’, ‘tab:cyan’} (case-insensitive);
定数も用意されているのでそれを確認してみましょう。
import matplotlib.pyplot as plt
import matplotlib.colors as mcolors

mcolors.TABLEAU_COLORS
'''
OrderedDict([('tab:blue', '#1f77b4'),
             ('tab:orange', '#ff7f0e'),
             ('tab:green', '#2ca02c'),
             ('tab:red', '#d62728'),
             ('tab:purple', '#9467bd'),
             ('tab:brown', '#8c564b'),
             ('tab:pink', '#e377c2'),
             ('tab:gray', '#7f7f7f'),
             ('tab:olive', '#bcbd22'),
             ('tab:cyan', '#17becf')])
'''
matplotlibで色を指定する部分に”tab:blue”と入れてやればいつも見慣れたTableauの青が表示されます。
(“tab:olive”は何か違うような気がするのですが僕の環境のせいでしょうか)
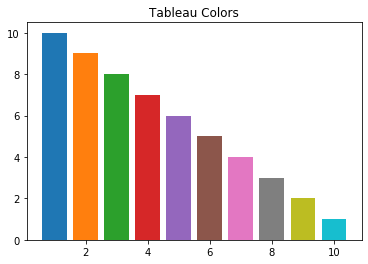
せっかくなので、10本の棒グラフを用意して使ってみましょう。
x = range(1, 11)
y = range(10, 0, -1)
fig = plt.figure()
ax = fig.add_subplot(111, title="Tableau Colors")
ax.bar(x, y, color=mcolors.TABLEAU_COLORS)
plt.show()
出力はこちら。