単に何かの領域を塗りつぶしたり、時系列データの予測モデルの信頼区間の可視化などで使われたり、
関数のグラフとx軸の間を塗りつぶしたりするあいつです。
matplotlibでは、fill_between というメソッドが用意されており、これを使って実現できます。
ドキュメント: matplotlib.axes.Axes.fill_between
通常の plot は xとyの値をリストか何かで渡しますが、fill_betweenでは、y1とy2という風にyの値を2ペア渡します。
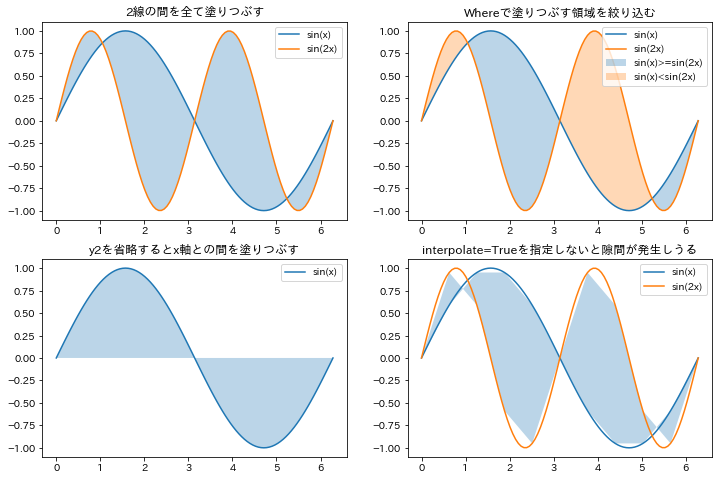
(なお、y2を省略すると、y1とx軸の間を塗りつぶしてくれます。)
また、 y1 と y2 の間を全て塗りつぶすのではなく、 where で、塗りつぶす領域を指定することもできます。
where に渡すのは x と同じ長さの True or False のリストです。
TrueとTrueの間が塗りつぶされます。
False, True, False のような孤立したTrueの分は塗りつぶされないので注意が必要です。
この他、 interpolate という引数が用意されています。
これは where が使われていて、かつ二つの曲線が閉じている場合に、はみ出さないように綺麗に塗ってくれるオプションです。
とりあえずTrue指定しておいて良いと思います。
この後サンプルコードを紹介しますが、最後の一つのグラフはあえて interpolate を指定せずに少しガタついてるグラフにしました。
import numpy as np
import matplotlib.pyplot as plt

# データ作成
x = np.linspace(0, 2*np.pi, 101)
y1 = np.sin(x)
y2 = np.sin(2*x)

fig = plt.figure(figsize=(12, 8), facecolor="w")
ax = fig.add_subplot(2, 2, 1, title="2線の間を全て塗りつぶす")
ax.plot(x, y1, label="sin(x)")
ax.plot(x, y2, label="sin(2x)")
ax.fill_between(
    x,
    y1,
    y2,
    alpha=0.3,
    interpolate=True,
)
ax.legend()

ax = fig.add_subplot(2, 2, 2, title="Whereで塗りつぶす領域を絞り込む")
ax.plot(x, y1, label="sin(x)")
ax.plot(x, y2, label="sin(2x)")
ax.fill_between(
    x,
    y1,
    y2,
    where=(y1 >= y2),
    alpha=0.3,
    interpolate=True,
    label="sin(x)>=sin(2x)"
)
ax.fill_between(
    x,
    y1,
    y2,
    where=(y1 < y2),
    alpha=0.3,
    interpolate=True,
    label="sin(x)<sin(2x)"
)
ax.legend()

ax = fig.add_subplot(2, 2, 3, title="y2を省略するとx軸との間を塗りつぶす")
ax.plot(x, y1, label="sin(x)")
ax.fill_between(
    x,
    y1,
    alpha=0.3,
    interpolate=True,
)
ax.legend()

ax = fig.add_subplot(2, 2, 4, title="interpolate=Trueを指定しないと隙間が発生しうる")
ax.plot(x, y1, label="sin(x)")
ax.plot(x, y2, label="sin(2x)")
ax.fill_between(
    x[::10],
    y1[::10],
    y2[::10],
    alpha=0.3,
)
ax.legend()

plt.show()
結果。