普段の分析でもこのブログでも、matplotlibの一つのfigureに複数のグラフを描写することがよくあります。
その時、稀に困るのがタイトルやラベルが他のグラフに重なってしまう時です。
それ以外にも微妙に感覚が詰まりすぎてたり広すぎたりで見た目が悪いなぁと思うことがあります。
その場合、subplots_adjustを使って、間隔を調整できます。
ドキュメントはこちら。
matplotlib.pyplot.subplots_adjust
引数の意味はこちらにもあります。
matplotlib.figure.SubplotParams
次の6種類の引数を渡せますが、間隔の調整に使うのは、hspaceとwspaceです。
The parameter meanings (and suggested defaults) are:
left = 0.125 # the left side of the subplots of the figure
right = 0.9 # the right side of the subplots of the figure
bottom = 0.1 # the bottom of the subplots of the figure
top = 0.9 # the top of the subplots of the figure
wspace = 0.2 # the amount of width reserved for space between subplots,
# expressed as a fraction of the average axis width
hspace = 0.2 # the amount of height reserved for space between subplots,
# expressed as a fraction of the average axis height
Copy to clipboard
The actual defaults are controlled by the rc file
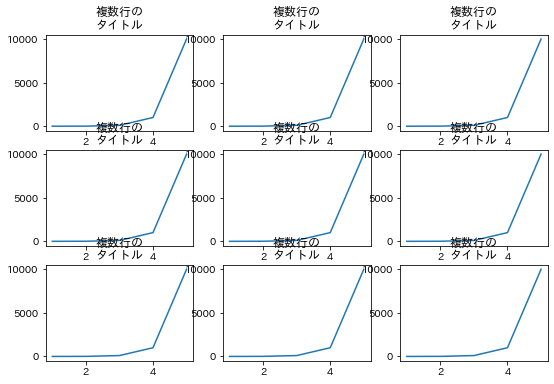
無理やり作った例で恐縮ですが、調整せずにグラフ間で重なってしまった例と、
subplots_adjustで調整した例を作りました。
import matplotlib.pyplot as plt
x = [1, 2, 3, 4, 5]
y = [1, 10, 100, 1000, 10000]
# 悪い例
fig = plt.figure(figsize=(9, 6),  facecolor="white")
for i in range(3):
    for j in range(3):
        ax = fig.add_subplot(3, 3, 1 + j + 3*i)
        ax.set_title("複数行の\nタイトル")
        ax.plot(x, y)
plt.show()
# 間隔を調整した例
fig = plt.figure(figsize=(9, 6),  facecolor="white")
fig.subplots_adjust(hspace=0.6, wspace=0.4)
for i in range(3):
    for j in range(3):
        ax = fig.add_subplot(3, 3, 1 + j + 3*i)
        ax.set_title("複数行の\nタイトル")
        ax.plot(x, y)
plt.show()
出力はそれぞれこちらです。
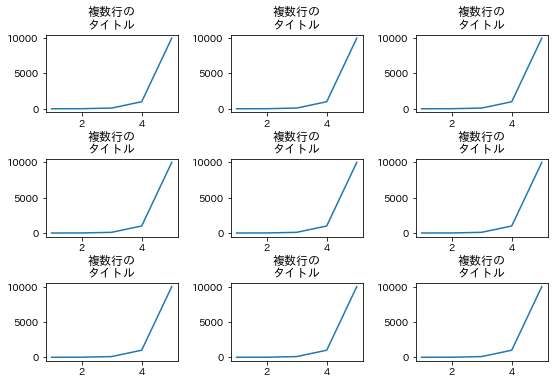
hspace=0.6 と wspace=0.4 の値ですが、これはドキュメント読んで何かしら計算して決めるより、
適当な値を入れて何度か試すのがおすすめです。
初期値はそれぞれ0.2なので、それより大きい値を入れると広くなります。